Re-Analyzing presidents data in Africa
I have had for long this fun idea of writing a good visualization on
presidents data and coups in Africa. In fact it was my first post. But I was not so advanced in dataviz up then. I was thinking about updating the visualizations based on web-scraped and available open datasets. Now that we have LLMs,
I wanted to explore the quality I can achieve by writing as less a possible code and using an agent (sonnet 4.6 medium).
My goal is not really to work on the narrative of issue, this is already well done by other media outlets1. I want more to explore in which ways our interactions can lead to an interesting data-viz outcome.
This blogpost is the result of my interactions with Claude code, using available tools at my disposal and a bit of coding skills.
This is a long blog post. You should read it as a conversation between me and the agent/assistant, and the outputs are shown here. I was writing and thinking at the same time, so expect some typos in my prompts. Between the lines, I discuss my approach to the problem, and show how time consuming some decisions can be.
You can jump directly to the final output
I started by thinking about how to structure the output of our interactions, so that I can have them embedded here in the blogpost.
interaction(c(1, 2))We are going to work on a blogpost on visualizing presidents data in Africa. The blogpost idea is to be show our whole conversation until we get our final output. As an analyst, you will write two things:
1-The output of our conversations in structured file that I will use to show people how we interact in the blogpost
2-R codes for achieving the final result.
Start by writing a script that will populate our interaction file during the whole work. Store it in our gitignored .draft/ folder. Also add there the prompts I will send you, including this first prompt.
Set up the .draft/africa-presidents/ folder with log_entry.sh (a bash+python script that appends JSON entries to conversation.json) and logged the first user prompt. The conversation.json file will grow as we work — each turn gets a role, timestamp, and message. Ready to start on the data and visualization.
Here is the output of the .sh file. Notice that LLMs usually use
python by default if available (worth learning now the language if you are a die hard R user).
#!/usr/bin/env bash
# Usage: ./log_entry.sh <role> <message>
# role: "user" | "assistant"
# message: the text to log (quote it)

ROLE="$1"
MESSAGE="$2"
LOG_FILE="$(dirname "$0")/conversation.json"

if [[ -z "$ROLE" || -z "$MESSAGE" ]]; then
  echo "Usage: $0 <user|assistant> <message>" >&2
  exit 1
fi

TIMESTAMP="$(date -u +"%Y-%m-%dT%H:%M:%SZ")"

# Bootstrap file if it doesn't exist
if [[ ! -f "$LOG_FILE" ]]; then
  echo '{"conversation": []}' > "$LOG_FILE"
fi

# Append entry using Python (available on macOS without extra deps)
python3 - "$LOG_FILE" "$ROLE" "$TIMESTAMP" "$MESSAGE" <<'PYEOF'
import sys, json

log_file, role, timestamp, message = sys.argv[1], sys.argv[2], sys.argv[3], sys.argv[4]

with open(log_file, "r") as f:
    data = json.load(f)

data["conversation"].append({
    "role": role,
    "timestamp": timestamp,
    "message": message
})

with open(log_file, "w") as f:
    json.dump(data, f, indent=2, ensure_ascii=False)

print(f"[{timestamp}] {role}: logged.")
PYEOF
Even without a full bash or python knowledge, you can guess
immediately what the script does. Populate at the end of each interaction
the user and assistant answers in a jsonfile. My first instinct was to think: who will
run it? before I noticed the agent has already run the ./log_entry.sh at the end of the conversation. So it is updating the file itself. I though using a hook was a less error prone approach but I was quite satisfied with the output.
My next step was to structure how the json will be added into this blogpost.
interaction(c(3, 4))Now, create an Rscript that will extract every interaction and populate them in my Rmarkdown file. I will comment the interaction progressively, so it should be quoted, user/assistant (without the timestamp) well formatted, and I must be able to use it directly in my blogpost so people can see/read the result of our interactions.
Created inject_conversation.R in .draft/africa-presidents/. It reads conversation.json, renders each turn as a colour-coded blockquote inside a <div class=conv-user|conv-assistant>, and writes the block between <!– conversation:start –> and <!– conversation:end –> markers in the Rmd (replacing on subsequent runs). Added matching CSS to the Rmd. Run with: Rscript -e “source(‘.draft/africa-presidents/inject_conversation.R’)” after each exchange.
This is where it got the instructions wrong (or I was not good in writing the prompt). I wanted something like a simple function. You can see this function is named interaction. But I got a file that populates everything at the end of the blogpost. So I asked to correct, and lost some time and money polishing a css (something I could have done myself).
interaction(c(5, 6, 7, 8, 9, 10))Thanks. I don’t want any color on the output of our interactions, you can use black-white gray everywhere with fixed fonts (to distinguish between interactions and my writings), and thick black left border for my prompt. Don’t use any > and “Me” for my prompt.
Updated the CSS to monospace font throughout, no colors (black/white/gray), thick 5px black left border on user turns, thin gray border on Claude turns. User turns have no label and no blockquote syntax — plain HTML paragraphs only. Claude turns keep a small uppercase ‘Claude’ label. Fixed a bug where the end marker on the last line produced a stray NA line.
The function was not written to allow direct usage in the R markdown script. I want to create chunks and have the result of say interaction(1), or interaction(id) directly in my blog post
Rewrote the approach: created conversation_helpers.R with an interaction(id) function that returns knitr::asis_output() HTML. Source it once in the setup chunk, then call interaction(1), interaction(c(1,2)), or interaction(‘all’) inside any {r, results=‘asis’} chunk. Removed the static injected block from the Rmd and replaced it with chunk calls.
I don’t think the interactions is in fixed width in the output.
Fixed CSS specificity: added explicit .conv-user p and .conv-assistant p rules targeting the paragraph tags, and switched from the generic ‘monospace’ keyword to the concrete ‘Courier New’, Courier, monospace stack so the blog theme cannot override it.
I got the css for the conversations:
<style>
.conv-user,
.conv-assistant {
  margin: 16px 0;
  padding: 10px 16px;
  line-height: 1.6;
}
.conv-user p,
.conv-assistant p,
.conv-user,
.conv-assistant {
  font-family: "Courier New", Courier, monospace;
  font-size: 14px;
}
.conv-user {
  border-left: 5px solid #000;
  background: #fff;
  color: #000;
}
.conv-user p {
  margin: 4px 0;
  color: #000;
}
.conv-assistant {
  border-left: 2px solid #aaa;
  background: #f5f5f5;
  color: #222;
}
.conv-assistant p {
  margin: 4px 0;
  color: #222;
}
.conv-assistant-label {
  font-family: "Courier New", Courier, monospace;
  font-weight: bold;
  font-size: 12px;
  text-transform: uppercase;
  letter-spacing: 0.08em;
  color: #555;
  margin-bottom: 6px;
}
</style>
And the full interaction function I have been using so far:
# conversation_helpers.R
library(jsonlite)
library(knitr)
.conv_data <- local({
cache <- NULL
function() {
if (is.null(cache)) {
path <- here::here(".draft", "africa-presidents", "conversation.json")
cache <<- fromJSON(path)$conversation
}
cache
}
})
.render_turn <- function(role, message) {
css_class <- if (role == "user") "conv-user" else "conv-assistant"
message <- gsub("\\\\n", "\n", message)
message <- gsub("&", "&", message, fixed = TRUE)
message <- gsub("<", "<", message, fixed = TRUE)
message <- gsub(">", ">", message, fixed = TRUE)
lines <- strsplit(message, "\n")[[1]]
paras <- paste0(
"<p>",
ifelse(nchar(trimws(lines)) == 0, " ", lines),
"</p>"
)
body <- paste(paras, collapse = "\n")
if (role == "assistant") {
paste0(
'<div class="',
css_class,
'">',
'<div class="conv-assistant-label">Claude</div>',
body,
'</div>'
)
} else {
paste0('<div class="', css_class, '">', body, '</div>')
}
}
#' Render one or more conversation turns inline in an Rmd chunk.
#'
#' @param id Integer index (1-based), integer vector, or "all".
#' @examples
#' ```{r, results="asis"}
#' interaction(1)
#' interaction(c(1, 2))
#' interaction("all")
#' ```
interaction <- function(id = "all") {
conv <- .conv_data()
idx <- if (identical(id, "all")) {
seq_len(nrow(conv))
} else {
as.integer(id)
}
if (any(idx < 1 | idx > nrow(conv))) {
stop(
"interaction(): id out of range. Conversation has ",
nrow(conv),
" turns."
)
}
html <- paste(
mapply(.render_turn, conv$role[idx], conv$message[idx]),
collapse = "\n"
)
knitr::asis_output(html)
}I now had to wire the conversation_helpers.R by sourcing it
at the beginning of the Rmd file, after putting it in a correct
directory. Claude got this process wrong and my file was not
rendering. But I was quickly able to know it came from nested
repos and used here to fix it.
I already knew where to download the required dataset for the analyses.
So my next prompt was about structuring the required dataset for vizs.
I also wanted to use the latest gglite package of Yihuie.
interaction(c(11, 12))We need some data to build our viz graphs. We will use two main sources of data:
1-Power & Thyne coup dataset (available at https://jonathanmpowell.com/coups/)
2-Archigos data base. There is a R package peacesciencer.
Prepare this whole datasets for visualisations that will answer those following questions:
-Where was the coup attempt in Africa
-When
-Was it a success
-What are the name of the leaders / putschists
We will also need maps of africa, available through the geodata R package (gadm)
Our visualisation will use the gglite R package which is interactive.
Write the script for downloading the required data inputs in the blog scripts folder, and add those data in the blog data folder.
Created blog-scripts/01_get_data_africa_presidents.R. It downloads the Powell & Thyne coup CSV (2026 version), loads Archigos from peacesciencer, joins each coup event to the incumbent leader at the time and the successor (putschist), downloads GADM country outlines for Africa via geodata, adds centroids for point maps, and saves coups_africa.rds, archigos_africa.rds, and africa_map.rds to blog-data/africa-presidents/. Added blog-data/ to .gitignore. Needed three debug fixes: wrong URL (404), read_tsv on a CSV, and .data[[]] scoping for countrycode inside mutate.
This was a long one. It took quite some times to run, but quite happy about the output:
library(readr)
library(dplyr)
library(lubridate)
library(countrycode)
library(peacesciencer)
library(geodata)
library(sf)
library(here)

OUT <- here("blog-data", "africa-presidents")
dir.create(OUT, showWarnings = FALSE, recursive = TRUE)

# ── 1. Power & Thyne coup dataset ─────────────────────────────────────────────
# Source: https://jonathanmpowell.com/coups/
# coup == 1 → successful coup; coup == 2 → failed attempt
PT_URL <- "https://jonathanmpowell.com/wp-content/uploads/2026/08/pt_20260829.csv"

message("Downloading Powell & Thyne coup data …")
coups_raw <- tryCatch(
  read_csv(PT_URL, show_col_types = FALSE),
  error = function(e) {
    stop(
      "Could not download Powell & Thyne data from:\n  ", PT_URL,
      "\nCheck https://jonathanmpowell.com/coups/ for the current URL."
    )
  }
)

# Standardise column names to lowercase
names(coups_raw) <- tolower(names(coups_raw))

# Add continent + ISO3 via COW numeric code
# The dataset already has a `country` text column; add continent/iso3c via ccode
coups_raw <- coups_raw |>
  mutate(
    iso3c     = countrycode(.data[["ccode"]], "cown", "iso3c"),
    continent = countrycode(.data[["ccode"]], "cown", "continent")
  )

coups_africa <- coups_raw |>
  filter(continent == "Africa") |>
  mutate(
    day         = if ("day" %in% names(coups_raw)) day else 1L,
    date        = as.Date(paste(year, month, day, sep = "-")),
    coup_result = case_when(
      coup == 1 ~ "Success",
      coup == 2 ~ "Attempt",
      TRUE      ~ NA_character_
    )
  ) |>
  select(ccode, iso3c, country, year, month, day, date, coup_result)

message("  African coup events: ", nrow(coups_africa))

# ── 2. Archigos leader tenures ────────────────────────────────────────────────
message("Loading Archigos data from peacesciencer …")
data(archigos)

archigos_clean <- archigos |>
  mutate(
    iso3c     = countrycode(.data[["gwcode"]], "gwn", "iso3c"),
    continent = countrycode(.data[["gwcode"]], "gwn", "continent"),
    country   = countrycode(.data[["gwcode"]], "gwn", "country.name"),
    start     = as.Date(startdate),
    end       = as.Date(enddate)
  )

archigos_africa <- archigos_clean |>
  filter(continent == "Africa") |>
  select(gwcode, iso3c, country, leader, gender, yrborn,
         start, end, entry, exitcode)

message("  African leader tenures: ", nrow(archigos_africa))

# ── 3. Join: who was in power at each coup, who came after ───────────────────
# For each coup event find:
#   - incumbent : leader in power on coup date
#   - successor : next leader after coup (the putschist when entry == "Irregular")

find_leader_on <- function(iso, d, df) {
  rows <- df |>
    filter(iso3c == iso, start <= d, (is.na(end) | end >= d))
  if (nrow(rows) == 0) return(NA_character_)
  rows$leader[1]
}

find_successor <- function(iso, d, df) {
  rows <- df |>
    filter(iso3c == iso, start > d) |>
    arrange(start)
  if (nrow(rows) == 0) return(NA_character_)
  rows$leader[1]
}

message("Linking coup events to Archigos leaders …")
coups_linked <- coups_africa |>
  rowwise() |>
  mutate(
    incumbent = find_leader_on(iso3c, date, archigos_africa),
    successor = find_successor(iso3c, date, archigos_africa)
  ) |>
  ungroup()

# ── 4. Africa map (GADM level 0 = country outlines) ──────────────────────────
message("Downloading GADM Africa map …")
africa_iso3 <- unique(na.omit(coups_africa$iso3c))

# Download each country and bind; geodata caches locally in tempdir by default
gadm_list <- lapply(africa_iso3, function(iso) {
  tryCatch(
    gadm(country = iso, level = 0, path = OUT) |> st_as_sf(),
    error = function(e) {
      message("  Skipping ", iso, ": ", conditionMessage(e))
      NULL
    }
  )
})

africa_map <- bind_rows(Filter(Negate(is.null), gadm_list)) |>
  rename(iso3c = GID_0, country = COUNTRY) |>
  select(iso3c, country, geometry)

# Country centroids for point maps
centroids_sf <- africa_map |> st_make_valid() |> st_centroid()
centroids <- centroids_sf |>
  st_drop_geometry() |>
  mutate(
    lon = st_coordinates(centroids_sf)[, 1],
    lat = st_coordinates(centroids_sf)[, 2]
  ) |>
  select(iso3c, lon, lat)

coups_final <- coups_linked |>
  left_join(centroids, by = "iso3c")

# ── 5. Save ───────────────────────────────────────────────────────────────────
saveRDS(coups_final,    file.path(OUT, "coups_africa.rds"))
saveRDS(archigos_africa, file.path(OUT, "archigos_africa.rds"))
saveRDS(africa_map,     file.path(OUT, "africa_map.rds"))

message("\nSaved to ", OUT, ":")
message("  coups_africa.rds     — ", nrow(coups_final), " coup events")
message("  archigos_africa.rds  — ", nrow(archigos_africa), " leader tenures")
message("  africa_map.rds       — ", nrow(africa_map), " countries (sf)")
Notice that the R script is written also for non interactive session,
with messages so a process running Rscript can get informations
about what it is doing. This is something I noticed a lot. The LLMs
usually write scripts mostly for non-interactive session (although
we can use them in interactive). The last part was to layout correctly the specifications of my visualizations, and telling the agent how we want the final output to look like.
Here is my prompt, followed by a lot of refinements I will spare you.
interaction(14)
Now the full specifications of our viz. We will add them to the Rmarkdown. So you should create the viz in such a way that a simple function in the Rmarkdown will add them to the rendered output, in the same logic as the interaction. Here is how we want to visualize the whole data. First, let’s start with our color code:
-Coups colors: #F4A582
-Failed coups colors: E6E6E6
-Titles in bold, top left
-Subtitles in italic, top left
-Legends on the top (preferably top-right)
-Sources at the bottom, in gray
Here is how you build the narrative.
1-First a time line showing overall coups per year in Africa, successful and failed, each coup is a tile on one year (in small square), multiple coups can stack up, hover on a tile shows the country, and people involved.
2-Second a map of Africa, but built with squares. Each square is a country. Add a slider for a year, moving the slider should show attempted/failed coup for each country (square) colored, so people can see how coups were poping up geographically. Clicking on a square should show the graph 1, but for that country only, and the boundaries of the country, (presented cleanly). With the timelines of deposed leaders
3-A barplot, with tiles again, but vertically, sorted by number of coups (attempted or not) on all the countries of Africa. So we know countries with most of the coups
4-Now we want to know for how long presidents have been in place in each of the country. For each country, compute the average length of a mandate/reign/power grab. Plot them by country but with tiles again, one tile is a president, clicking on the tile shows the president name, start/end. In that specific case use the same colors, but sort starting with countries with the longest serving people.
Use gglite first and other htmlwidgets packages. For each graph, add very nice labels, titles, and short explanation of what it is showing.
I think the right approach is to divide my work into small steps again : A prompt for generating the js and the interactions, a prompt for coding the charts with gglite and one prompt for each of the charts. I thought I could send one bulk prompt and get the final output. It failed.
Because I was not having the output I wanted (and was quite frustrated by that), I moved first to fable to set the basis, then came back to opus and sonnet to polish. I added a few more interactions (11 more), after asking fable to fix the output of sonnet, before polishing with opus. I also noticed some datasets were not up to date (archigos stopped in 2015). So I completed with data from wikipedia after confronting the results. I can say that the wikipedia data had a lot of errors, and this crosschecking step surfaced a lot of inconsistencies.
During the interactions, I had crop images from wikipedia of the leaders using opus. I am quite amazed about the quality of the output. Finally I did some few refinements on the labels, data-sources, without touching the code.
Enjoy the final output!2
The visualizations
1 — Coup events across time
161 of the 223 events are concentrated in four decades from the 1960s to the 1990s. The year with most coups is 1966, with 10.
Coups in Africa, year by year
Each square is one coup event: 223 since 1950, of which 111 succeeded. Hover a square to see the country and the people involved.
Source: Powell & Thyne coup dataset (version 2026-08-29). Leaders: Archigos 4.1 via the `peacesciencer` R package up to 2015; Wikipedia after 2015, and for São Tomé and Príncipe and Seychelles. Names: Wikipedia, or Archigos where Wikipedia has no match. Portraits: drawn from photographs of Wikimedia Commons, credited at the end of the post.
2 — Where did coups happen?
Let’s start with a static comparative map, if you want to get an idea of how the years compare to each other:
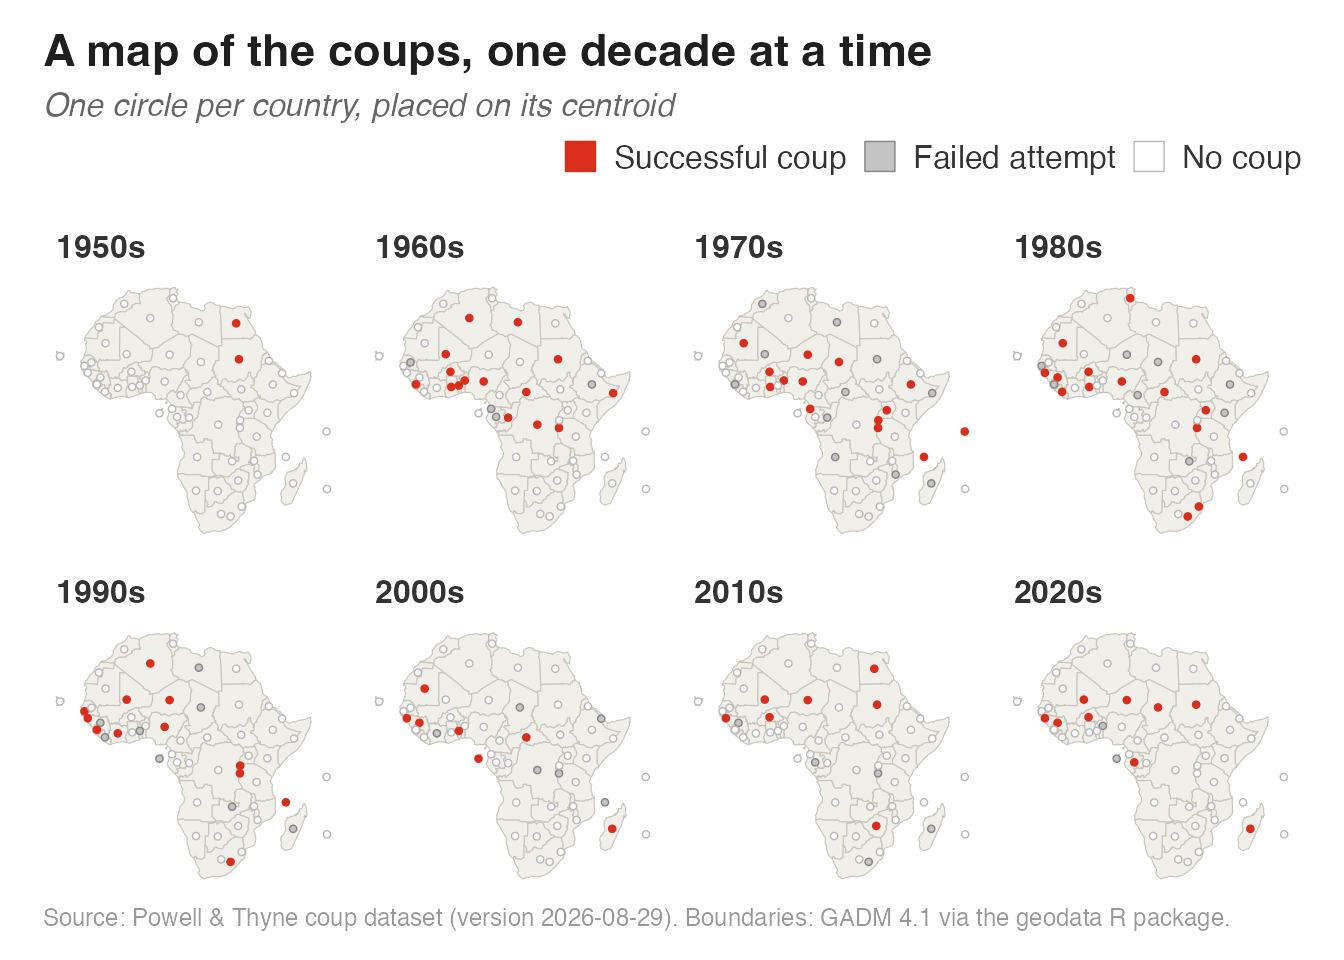
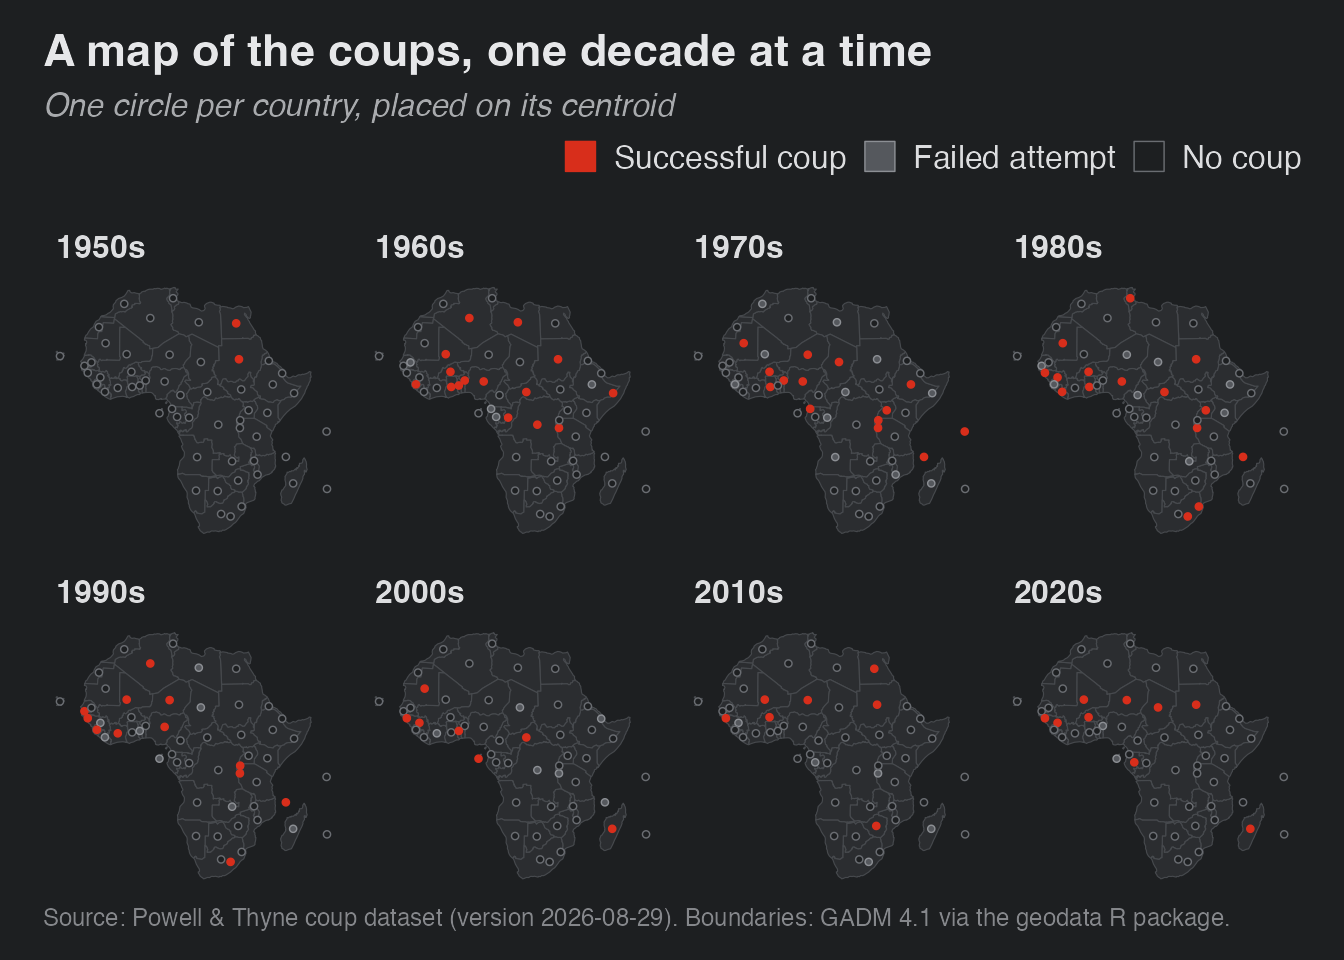
Then an interactive view of the whole data: move the slider, or press play, to watch the coups appear year after year. Click a circle to open the country.
A map of the coups, one year at a time
One circle per country, placed on its centroid. Move the slider to change the year. Click a circle for the country's own timeline, its boundaries and its leaders.
Click a circle to open the history of that country.
Source: Powell & Thyne coup dataset (version 2026-08-29). Leaders: Archigos 4.1 via the `peacesciencer` R package up to 2015; Wikipedia after 2015, and for São Tomé and Príncipe and Seychelles. Boundaries: GADM 4.1 via the geodata R package. Names: Wikipedia, or Archigos where Wikipedia has no match. Portraits: drawn from photographs of Wikimedia Commons, credited at the end of the post.
3 — Countries with the most coups
Sudan had 17 events, 6 of them successful. Nine countries never had any coup (attempted or not).
Coup events per country
One square per coup event since 1950, in chronological order. Countries are sorted by their total, the gray number. 9 of the 54 countries had none. Hover or click a square to see the people involved.
Source: Powell & Thyne coup dataset (version 2026-08-29). Leaders: Archigos 4.1 via the `peacesciencer` R package up to 2015; Wikipedia after 2015, and for São Tomé and Príncipe and Seychelles. Names: Wikipedia, or Archigos where Wikipedia has no match. Portraits: drawn from photographs of Wikimedia Commons, credited at the end of the post.
4 — How long have leaders held power?
The fewer the squares, the longer each leader stayed. Click a square to see who it was.
Years in power, leader by leader
Leaders in office since 1950, one square per leader in chronological order, with the years spent in power. Countries are sorted by their average tenure, the gray number, longest first. Click a square for the name and the dates.
Leaders: Archigos 4.1 via the `peacesciencer` R package up to 2015; Wikipedia after 2015, and for São Tomé and Príncipe and Seychelles. A + marks a leader still in office on 28 Sep 2026. A tenure that begins with a coup of Powell & Thyne counts as taken by force, even where Archigos codes it as regular.
Portraits: the 167 photographs behind the drawings
Each portrait is a pencil drawing made by program from a photograph of Wikimedia Commons, cropped to the face. A drawing keeps the licence of its photograph. Leaders without a free photograph are shown as a silhouette.
- Abdalla Hamdok: photograph by Office of USAID Administrator, Public domain
- Abdallah Khalil: photograph by Unknown Sudanese Government photographer, Public domain
- Abdel Fattah al-Burhan: photograph by Press Service of the President of the Republic of Azerbaijan, CC BY 4.0
- Abdel Rahman Swar al-Dahab: photograph by Unknown Military Photographer, Public domain
- Abdirashid Shermarke: photograph by Government of Somalia, Public domain
- Abdourahamane Tiani: photograph by Sule Barma, Public domain
- Abubakar Tafawa Balewa: photograph by Abubakar, CC BY-SA 3.0
- Aden Adde: photograph by Somalia Government, Public domain
- Agostinho Neto: photograph by Rob Mieremet / Anefo, CC0
- Ahmad Tejan Kabbah: photograph by Christian Lambiotte / European Communities, CC BY 4.0
- Ahmed Ben Bella: photograph by République Algérienne, Public domain
- Ahmed Naguib el-Hilaly: photograph by unknown author, Public domain
- Alfred Raoul: photograph by Dibas, CC BY-SA 3.0
- Ali Bongo: photograph by United States Department of State Africa U.S.-Africa Leaders Summit: Photos and Videos, Public domain
- Alpha Condé: photograph by World Economic Forum, CC BY-SA 2.0
- Alphonse Massamba-Débat: photograph by Post of Congo, Republic (Brazzaville), Public domain
- Amadou Sanogo: photograph by Kassim Traoré (VOA), Public domain
- Amadou Toumani Touré: photograph by LulaAmadouToure.jpg: Antonio Cruz/ABr; derivative work: Missionary (talk), CC BY 2.5 br
- Aman Andom: photograph by unknown author, Public domain
- Andry Rajoelina: photograph by 外務省, CC BY 4.0
- Ange-Félix Patassé: photograph by Tanguy Jockmans - European Commission, CC BY 4.0
- Assimi Goïta: photograph by President of Russia,Kremlin, CC BY 4.0
- Azali Assoumani: photograph by U.S. Department of State, Public domain
- Bah Ndaw: photograph by Michele Cattani, European Commission, CC BY 4.0
- Blaise Compaoré: photograph by Antônio Cruz/ABr; cropped, and resized by en:User:Hajor, Attribution
- Brice Oligui Nguema: photograph by Lukasz Kobus / European Communities, 2024 / EC - Audiovisual Service, CC BY 4.0
- Carlos Vila Nova: photograph by ITU Pictures, CC BY 2.0
- Chadli Bendjedid: photograph by Présidence, Public domain
- Daniel arap Moi: photograph by Croes, Rob C. / Anefo, CC BY-SA 3.0 nl
- David Dacko: photograph by David Eldan, Public domain
- David Lansana: photograph by Moshe Milner, Public domain
- Dawda Jawara: photograph by Fernando Pereira / Anefo, CC BY-SA 3.0 nl
- Didier Ratsiraka: photograph by Benoît Bourgeois / European Commission, CC BY 4.0
- Dioncounda Traoré: photograph by DioncoundaTraore2012, CC BY-SA 3.0
- Ely Ould Mohamed Vall: photograph by Denis Closon / European Communities, 2006 / EC - Audiovisual Service, CC BY 4.0
- Emmerson Mnangagwa: photograph by Government of Zimbabwe, Public domain
- Emperor Haile Selassie: photograph by unknown; according to [1] and [2] an official portrait of which b/w copies were distributed by the Ethiopian government, Public domain
- Ernest Shonekan: photograph by Foreign and Commonwealth Office, OGL v1.0
- Faure Gnassingbé: photograph by Press Service of the President of the Republic of Azerbaijan, CC BY 4.0
- Fradique de Menezes: photograph by Official White House Photo by Lawrence Jackson, Public domain
- France-Albert René: photograph by Seychelles Nation, Public domain
- Francisco Macías Nguema: photograph by Anefo, CC0
- François Bozizé: photograph by UNDP/hdptcar, CC BY-SA 2.0
- François Tombalbaye: photograph by Moshe Pridan, Public domain
- Frederick Chiluba: photograph by European Communities, 1994 / EC - Audiovisual Service, CC BY 4.0
- Fulbert Youlou: photograph by Republic of the Congo, Ministry of Information, Public domain
- Gaafar Nimeiry: photograph by unknown author, Public domain
- Gnassingbé Eyadéma: photograph by SrA Felicia Wilson, Public domain
- Grégoire Kayibanda: photograph by © European Union 2019 - Source : EP, European Parliament
- Gérard Kango Ouédraogo: photograph by unknown author, Public domain
- Habib Bourguiba: photograph by Habib Osman, Public domain
- Hamani Diori: photograph by Kroon, Ron / Anefo, CC BY-SA 3.0 nl
- Henri Konan Bédié: photograph by Benoît Bourgeois / European Communities, 1997 / EC - Audiovisual Service, CC BY 4.0
- Hissène Habré: photograph by Series: Reagan White House Photographs, 1/20/1981 - 1/20/1989 ; Collection: White House Photographic Collection, 1/20/1981 - 1/20/1989, Public domain
- Honoré Traoré: photograph by Zoumana Wologo (VOA), Public domain
- Hosni Mubarak: photograph by unknown author, Public domain
- Houari Boumédiène: photograph by unknown author, Public domain
- Hubert Maga: photograph by State of Israel Press Office, Public domain
- Ibrahim Abboud: photograph by unknown author, Public domain
- Ibrahim Babangida: photograph by Seiperi, CC BY-SA 3.0
- Ibrahim Boubacar Keïta: photograph by Photo Claude TRUONG-NGOC, CC BY-SA 3.0
- Ibrahim Traoré: photograph by Bamjo226, CC0
- Idi Amin: photograph by Bernard Gotfryd, Public domain
- Idriss Déby: photograph by Office of the White House (Amanda Lucidon), Public domain
- Ismaïl Omar Guelleh: photograph by Robert D. Ward, Public domain
- James Mancham: photograph by Seychelles News Agency, CC BY 4.0
- Jean-Baptiste Bagaza: photograph by Jean-Louis Debaize, CC BY 4.0
- Jean-Baptiste Ouédraogo: photograph by Lamine Traoré, Voice of America, Public domain
- Jean-Bédel Bokassa: photograph by Jean-Bedel Bokassa & Nicolae Ceaușescu, 1970.jpg: unknown, image comes from the National Archives; derivative work: Makakaaaa (talk), Attribution
- Jerry Rawlings: photograph by Mark Renders / European Communities, 1998 / EC - Audiovisual Service, CC BY 4.0
- Johnny Paul Koroma: photograph by Eric Beauchemin, CC BY-SA 4.0
- Johnson Aguiyi-Ironsi: photograph by unknown author, Public domain
- Joseph Arthur Ankrah: photograph by Yoichi Okamoto, Public domain
- Joseph Kabila: photograph by U.S. Department of State from United States, Public domain
- Joseph Kasa-Vubu: photograph by Anefo, CC0
- Joseph Saidu Momoh: photograph by White House Television Office, Public domain
- João Bernardo Vieira: photograph by Wilson Dias/ABr, CC BY 3.0 br
- Julius Maada Bio: photograph by European Commission, CC BY 4.0
- Justin Ahomadégbé-Tomêtin: photograph by Fritz Cohen, Public domain
- Juvénal Habyarimana: photograph by DF-SC-83-02204.jpg: Templeton; derivative work: César (talk), Public domain
- Kenneth Kaunda: photograph by Unknown photographer, Public domain
- King Farouk I: photograph by unknown author, Public domain
- King Hassan II: photograph by Christian Lambiotte, CC BY 4.0
- King Idris I: photograph by Anefo, CC0
- King Letsie III: photograph by IAEA Imagebank, CC BY-SA 2.0
- King Mwambutsa IV: photograph by Fritz Cohen, Public domain
- Kofi Abrefa Busia: photograph by MWteL, CC BY-SA 4.0
- Kumba Yala: photograph by Nammarci, CC BY 3.0
- Kwame Nkrumah: photograph by USSR Post, Public domain
- Lansana Conté: photograph by White House Television Office, Public domain
- Laurent Gbagbo: photograph by Zenman, CC BY-SA 3.0
- Leabua Jonathan: photograph by Joost Evers / Anefo, CC BY-SA 3.0 nl
- Louis Lansana Beavogui: photograph by Renate Patzek, CC BY-SA 3.0 de
- Luís Cabral: photograph by EC Audiovisual Center, CC BY 4.0
- Léon M'ba: photograph by Israeli GPO photographer, Public domain
- Léopold Sédar Senghor: photograph by Bundesarchiv_B_145_Bild-F011981-0003,_Frankfurt-Main,_Staatspräsident_von_Senegal.jpg: Steiner, Egon; derivative work: RoyFocker 12 (talk), CC BY-SA 3.0
- Maaouya Ould Sid'Ahmed Taya: photograph by VOA News, Public domain
- Mahamadou Issoufou: photograph by Rama, CC BY-SA 2.0 fr
- Mahamane Ousmane: photograph by Niger77, Public domain
- Mahamat Déby: photograph by United States Department of State Africa U.S.-Africa Leaders Summit: Photos and Videos, Public domain
- Malam Bacai Sanhá: photograph by Roosewelt Pinheiro, CC BY 3.0 br
- Mamadi Doumbouya: photograph by Ambassade des Etats-Unis Conakry, Guinée, Public domain
- Mamadou Tandja: photograph by Ibrahim Alfa Ahmed, Voice of America Hausa Service, Public domain
- Marc Ravalomanana: photograph by Mogens Engelund, CC BY-SA 3.0
- Marien Ngouabi: photograph by V13point4, CC0
- Mathieu Kérékou: photograph by Ricardo Stuckert/ABr, CC BY 3.0 br
- Maurice Yaméogo: photograph by unknown, Service de Presse et d'Information. France., Public domain
- Melchior Ndadaye: photograph by RTNB (Burundi National Radio and Television), CC BY 3.0
- Mengistu Haile Mariam: photograph by unknown author, Public domain
- Michael Randrianirina: photograph by Presidential Executive Office of Russia, CC BY 4.0
- Michel Kafando: photograph by Etienne Ansotte / European Union, 2015 / EC - Audiovisual Service, CC BY 4.0
- Michel Micombero: photograph by unknown author, Public domain
- Miguel Trovoada: photograph by European Commission, European Communities, CC BY 4.0
- Milton Obote: photograph by Warren K. Leffler, Public domain
- Mobutu Sese Seko: photograph by Frank Hall, Public domain
- Modibo Keïta: photograph by Robert LeRoy Knudsen, Public domain
- Mohamed Bazoum: photograph by Photographer: Bogdan Hoyaux, CC BY 4.0
- Mohamed Boudiaf: photograph by Algeria Press Service, CC BY 3.0
- Mohamed Khouna Ould Haidalla: photograph by EC/Christian Lambiotte, CC BY 4.0
- Mohamed Morsi: photograph by Wilson Dias/ABr, CC BY 3.0 br
- Mohamed Ould Abdel Aziz: photograph by Office of the White House (Amanda Lucidon), Public domain
- Moktar Ould Daddah: photograph by European Communities, 1978 / EC - Audiovisual Service, CC BY 4.0
- Moussa Dadis Camara: photograph by Diplomatica, Public domain
- Moussa Traoré: photograph by Rob Bogaerts for Anefo, CC BY-SA 3.0 nl
- Muammar Gaddafi: photograph by Hamza Turkia, © European Union, 2010, CC BY 4.0
- Muhammad Ahmad Mahgoub: photograph by unknown author, CC BY-SA 3.0 nl
- Muhammad Hussein Tantawy: photograph by Helene C. Stikkel, Public domain
- Muhammadu Buhari: photograph by Bayo Omoboriowo, CC BY-SA 4.0
- Murtala Muhammed: photograph by unknown author, Public domain
- Mustafa Ould Salek: photograph by unknown author, CC BY 4.0
- Nicolas Grunitzky: photograph by Moshe Pridan (Israel National Photo Collection), Public domain
- Ntsu Mokhehle: photograph by unknown author, Public domain
- Omar al-Bashir: photograph by U.S. Navy photo by Mass Communication Specialist 2nd Class Jesse B. Awalt, Public domain
- Patrice Lumumba: photograph by Harry Pot for Anefo ), CC BY 4.0
- Patrice Talon: photograph by Office of USAID Administrator, Public domain
- Paul Biya: photograph by United States Department of State Africa U.S.-Africa Leaders Summit: Photos and Videos, Public domain
- Paul-Henri Sandaogo Damiba: photograph by Lamine Traoré (VOA), Public domain
- Pierre Buyoya: photograph by Chatham House, CC BY 2.0
- Pierre Nkurunziza: photograph by Copyright World Economic Forum/Eric Miller, (mailto:emiller@iafrica.com), CC BY-SA 2.0
- Queen Regent Ntombi: photograph by 中華民國總統府, CC BY 4.0
- Raimundo Pereira: photograph by Vince Crawley, Public domain
- Robert Guéï: photograph by BeraDigle, CC0
- Robert Mugabe: photograph by Government of Zimbabwe, taken by Joseph Nyadzayo as Presidential Photographer, Public domain
- Roch Marc Christian Kaboré: photograph by Théodore Boermans / European Commission, CC BY 4.0
- Sadiq al-Mahdi: photograph by RomanDeckert, CC BY-SA 4.0
- Said Mohamed Djohar: photograph by CEC, European Communities, CC BY 4.0
- Salou Djibo: photograph by Annassara, Public domain
- Samora Machel: photograph by Department of Defense. American Forces Information Service. Defense Visual Information Center. 1994, Public domain
- Samuel Doe: photograph by Photographer: Frank Hall, Treatment: Frank C. Müller, Public domain
- Sangoulé Lamizana: photograph by EC Audiovisual Center, CC BY 4.0
- Seyni Kountché: photograph by Anjely at German Wikipedia, CC BY-SA 3.0
- Shehu Shagari: photograph by Clawson, Public domain
- Siad Barre: photograph by Government of Somalia, Public domain
- Siaka Stevens: photograph by European Communities, 1979 / EC - Audiovisual Service, CC BY 4.0
- Sidi Ould Cheikh Abdallahi: photograph by Marcello Casal Jr./Abr, CC BY 3.0 br
- Sourou-Migan Apithy: photograph by unknown, Présence Congolaise, Public domain
- Sylvanus Olympio: photograph by Robert LeRoy Knudsen, Public domain
- Sylvestre Ntibantunganya: photograph by Thierry Dauwe - European Commission, CC BY 4.0
- Teodoro Obiang Nguema Mbasogo: photograph by U.S. Department of State, Public domain
- Thomas Sankara: photograph by The Militant/ Ernest Harsch, Public domain
- Tom Thabane: photograph by Foreign and Commonwealth Office, OGL v1.0
- Umaro Sissoco Embaló: photograph by European Union, Attribution
- William Tolbert: photograph by Kightlinger, Jack E., Photographer, Public domain
- Yahya Jammeh: photograph by Office of the White House (Amanda Lucidon), Public domain
- Yakubu Gowon: photograph by User:Rkasesela per [1], CC BY-SA 3.0
- Zine El Abidine Ben Ali: photograph by unknown author, CC BY 2.0
- Émile Derlin Zinsou: photograph by Martha Hellwig, Public domain


This is the source of inspiration for this post↩︎
- That last part (building the graph) failed completely with sonnet. I had to use more demanding models instead. Look for example at this correction prompt (showing some frustration):
Let’s now work on the first graph Coups in Africa since 1950. There is no need for a year slider. Second, you did not use our color conventions. Third, the coups is not well visible (width, height). Fourth clicking on a square is showing the y_pos, year (not what was asked). The tile should be Coups in Africa. Legend is showing arrows 1/2; 2/2.
↩︎