Analysing military coup in Africa
This first post will be a little political. As I read on BBC last Monday about an attempt coup in Gabon which has not succeed, I came up with the same question as the website: Is Africa seeing fewer military takeover attempts? In the BBC’s article, they use data from researchers of University of Central Florida to give at glance the answer to the question. Which end up to be yes. I wanted to reproduce the same type of analysis to have an idea of what has been in Africa these recent years, using data from Center for Systemic Peace1 on coups d’Etats, since 2017. I use a descriptive approach in this analysis.
Packages I used and some definitions
The dplyr and ggplot2 package for tidy-data manipulation and visualization. Loading the package:
library(dplyr)
library(ggplot2)

knitr::opts_chunk$set(
  warning = FALSE, message = FALSE, comment = "##"
)
Before we start, we should clarify what we mean by coups in our analysis. I will just cite my data source for clarification purposes.
For purposes of this compilation, a coup d’Etat is defined as a forceful seizure of executive authority and office by a dissident/opposition faction within the country’s ruling or political elites that results in a substantial change in the executive leadership and the policies of the prior regime (although not necessarily in the nature of regime authority or mode of governance). Social revolutions, victories by oppositional forces in civil wars, and popular uprisings, while they may lead to substantial changes in central authority, are not considered coups d’état. Voluntary transfers of executive authority or transfers of office due to the death or incapacitance of a ruling executive are, likewise, not considered coups d’état. The forcible ouster of a regime accomplished by, or with the crucial support of, invading foreign forces is not here considered a coup d’état.
Inspecting the data
The first step is to take a look on the data which has been converted into
csv format to ease the analysis.
coups_data <- read.csv("data/coups_data.csv", header = TRUE)

head(coups_data)
## country scode mth day year success
## 1 Haiti HAI 1 11 1946 1
## 2 Uruguay URU 7 1 1946 3
## 3 Portugal POR 10 10 1946 2
## 4 Hungary HUN 12 31 1946 4
## 5 Nicaragua NIC 5 25 1947 1
## 6 Italy ITA 6 22 1947 3The data consists of countries (country) where there have been coups, the date
of the supposed coup (mth, day, year) and the type of the coup in the
variable success for: 1 (succeed), 2 (attempt failed), 3 (plotted),
4 (alleged). Since the plotted and alleged coups seem to be difficult to confirm, I
will personally take them off from the analysis. I didn’t add all the other
variables to the data set like death, etc. as I am only concerned about the
number of coups. Also, it would be interesting to identify Africa countries
among those of the world, they are the purpose of my analysis.
The data management part.
The data contains
codes for countries, but unfortunately, they are not ISO-codes. African
countries are not so much after all hum… I found them and I will create a variable
that will index African countries, using the “so-personal” vector of codes of countries
in the scode variable. I wanted to have a glimpse at West Africa states, since I am from
West Africa. I have done the same thing for West Africa countries to index
them too. Let’s dive into the data management part.
african_codes <- c('ALG','ANG','BEN','BFO','BUI','CAO','CAP','CEN','CHA',
                   'COM','CON','DJI','EGY','EQG','ERI','ETH','ETI','GAB',
                   'GAM','GHA','GNB','GUI','IVO','KEN','LBR','LES','LIB',
                   'MAA','MAG','MAW','MLI','MOR','MZM','NIG','NIR','RWA',
                   'SAF','SDN','SEN','SIE','SOM','SSU','SUD','SWA','TAZ',
                   'TOG','TUN','UGA','ZAI','ZAM','ZIM')

west_africa_codes <- c('GHA','GUI','NIG','SEN','TOG','BEN','BFO','SIE',
                       'MLI','NIR','GNB','CAP','MAA','LBR','IVO','GAM')

coups_data <- coups_data %>%
  filter(success == 1 | success == 2) %>%
  mutate(is_africa = as.numeric(scode %in% african_codes),
         is_west_africa = as.numeric(scode %in% west_africa_codes))


head(coups_data)
## country scode mth day year success is_africa is_west_africa
## 1 Haiti HAI 1 11 1946 1 0 0
## 2 Portugal POR 10 10 1946 2 0 0
## 3 Nicaragua NIC 5 25 1947 1 0 0
## 4 Ecuador ECU 9 2 1947 2 0 0
## 5 Thailand THI 11 8 1947 1 0 0
## 6 Czechoslovakia CZE 2 25 1948 1 0 0Number of coups (attempted failed or succeed) in Africa compare to the rest of the world
I need to find a way to rename columns in the tidyverse framework, to allow
using of the pipe operator %>%. I decided to add a little function to do so 2.
rename_columns <- function(thedata, new_names){
  colnames(thedata) <- new_names
  thedata
}

coups_data %>%
  group_by(is_africa) %>%
  summarize(nb = n()) %>%
  ungroup() %>%
  mutate(is_africa = recode(is_africa,`
                            1` = "Africa Countries",
                            `0` = "Non Africa Countries"),
         perc = round(100*nb/sum(nb),2)
         ) %>%
  rename_columns(c("Countries groups",
                   "Number of Coups since 1946",
                   "Percentage" )) %>%
  DT::datatable(options = list(dom = "t"))
From 1946 to 2017, using the data on attempted failed or succeed coups, 45% of
coups have been held in Africa, compare to the rest of the world. What are the
dynamics along years in Africa? Let’s take a look with a ggplot2 graphic.
First I will create a segment data for joining
The Africa part
create_year_plot <- function(data){

  data %>%
  group_by(year) %>%
  summarize(nb = n()) %>%
  ungroup() %>%
  ggplot()+
  geom_bar(aes(x = year, y = nb, color = success),
           stat = "identity",
           width = 0.05,
           colour = "lightblue")+
  geom_point(aes(x = year, y = nb),
             color = "darkblue",
             size = 2)+
  geom_vline(xintercept = 1960, color = "red")+
  scale_y_continuous(breaks = 1:10)+
  scale_x_continuous(breaks = seq(1950, 2017, by = 5))+
  theme_light()+
  labs(x = "Years from 1946 to 2017",
       y = "Number of Coups")
}

coups_data %>%
  filter(as.logical(is_africa)) %>%
  create_year_plot()
Figure 1: Number of Coups (suceed or attempted) in africa since 1946, redline at 1960 indicates the beginning of independance for most countries
Since 2000, the number of coups in Africa has fallen down, comparing to the previous years. We can also notice that between five to ten years after independences, the number of coups (attempted failed and succeed) was really high comparing to recent decade with 10 coups in the year 1980. Except from recent coup attempt in Gabon in 2018, there has not been coup in the continent since 20153. Since 2005, the number of coups per year is no longer greater than 6 at the whole continent level, and turns around 3 to 2. What about west Africa countries?
coups_data %>%
  filter(as.logical(is_west_africa)) %>%
  create_year_plot()
Figure 2: Number of Coups in West Africa since 1946, redline at 1960 indicates the beginning of independance for most countries
We notice the same trend at the global level, with no coups since 2015 in west Africa countries. However, right after years 1990, the number of coups raised up, due perhaps to national conferences in west Africa countries which imply a change of regime, by military force, street voice or democratic elections.
We conclude with this graph showing where the coups have been at the continent level during our period of study and where there have been a lot of success - I know you would like to have a map…
coups_data %>%
  filter(as.logical(is_africa)) %>%
  group_by(country, year, success) %>%
  summarise(nb = n()) %>%
  ungroup() %>%
  mutate(success = recode(success,
                          `1` = "Succeed",
                          `2` = "Attempt failed")
         ) %>%
  ggplot()+
    geom_tile(aes(y = country, x = year, fill = success),
              color = "darkblue",
              size = 0.3, width = 1)+
    scale_x_continuous(breaks = 1950:2017)+
    theme_bw()+
    theme(axis.text.x = element_text(angle = 90))+
    labs(x = "Years from 1946 to 2017", y = "Countries")+
    scale_fill_manual(values = c("#e5e0e2", "#f992bb"))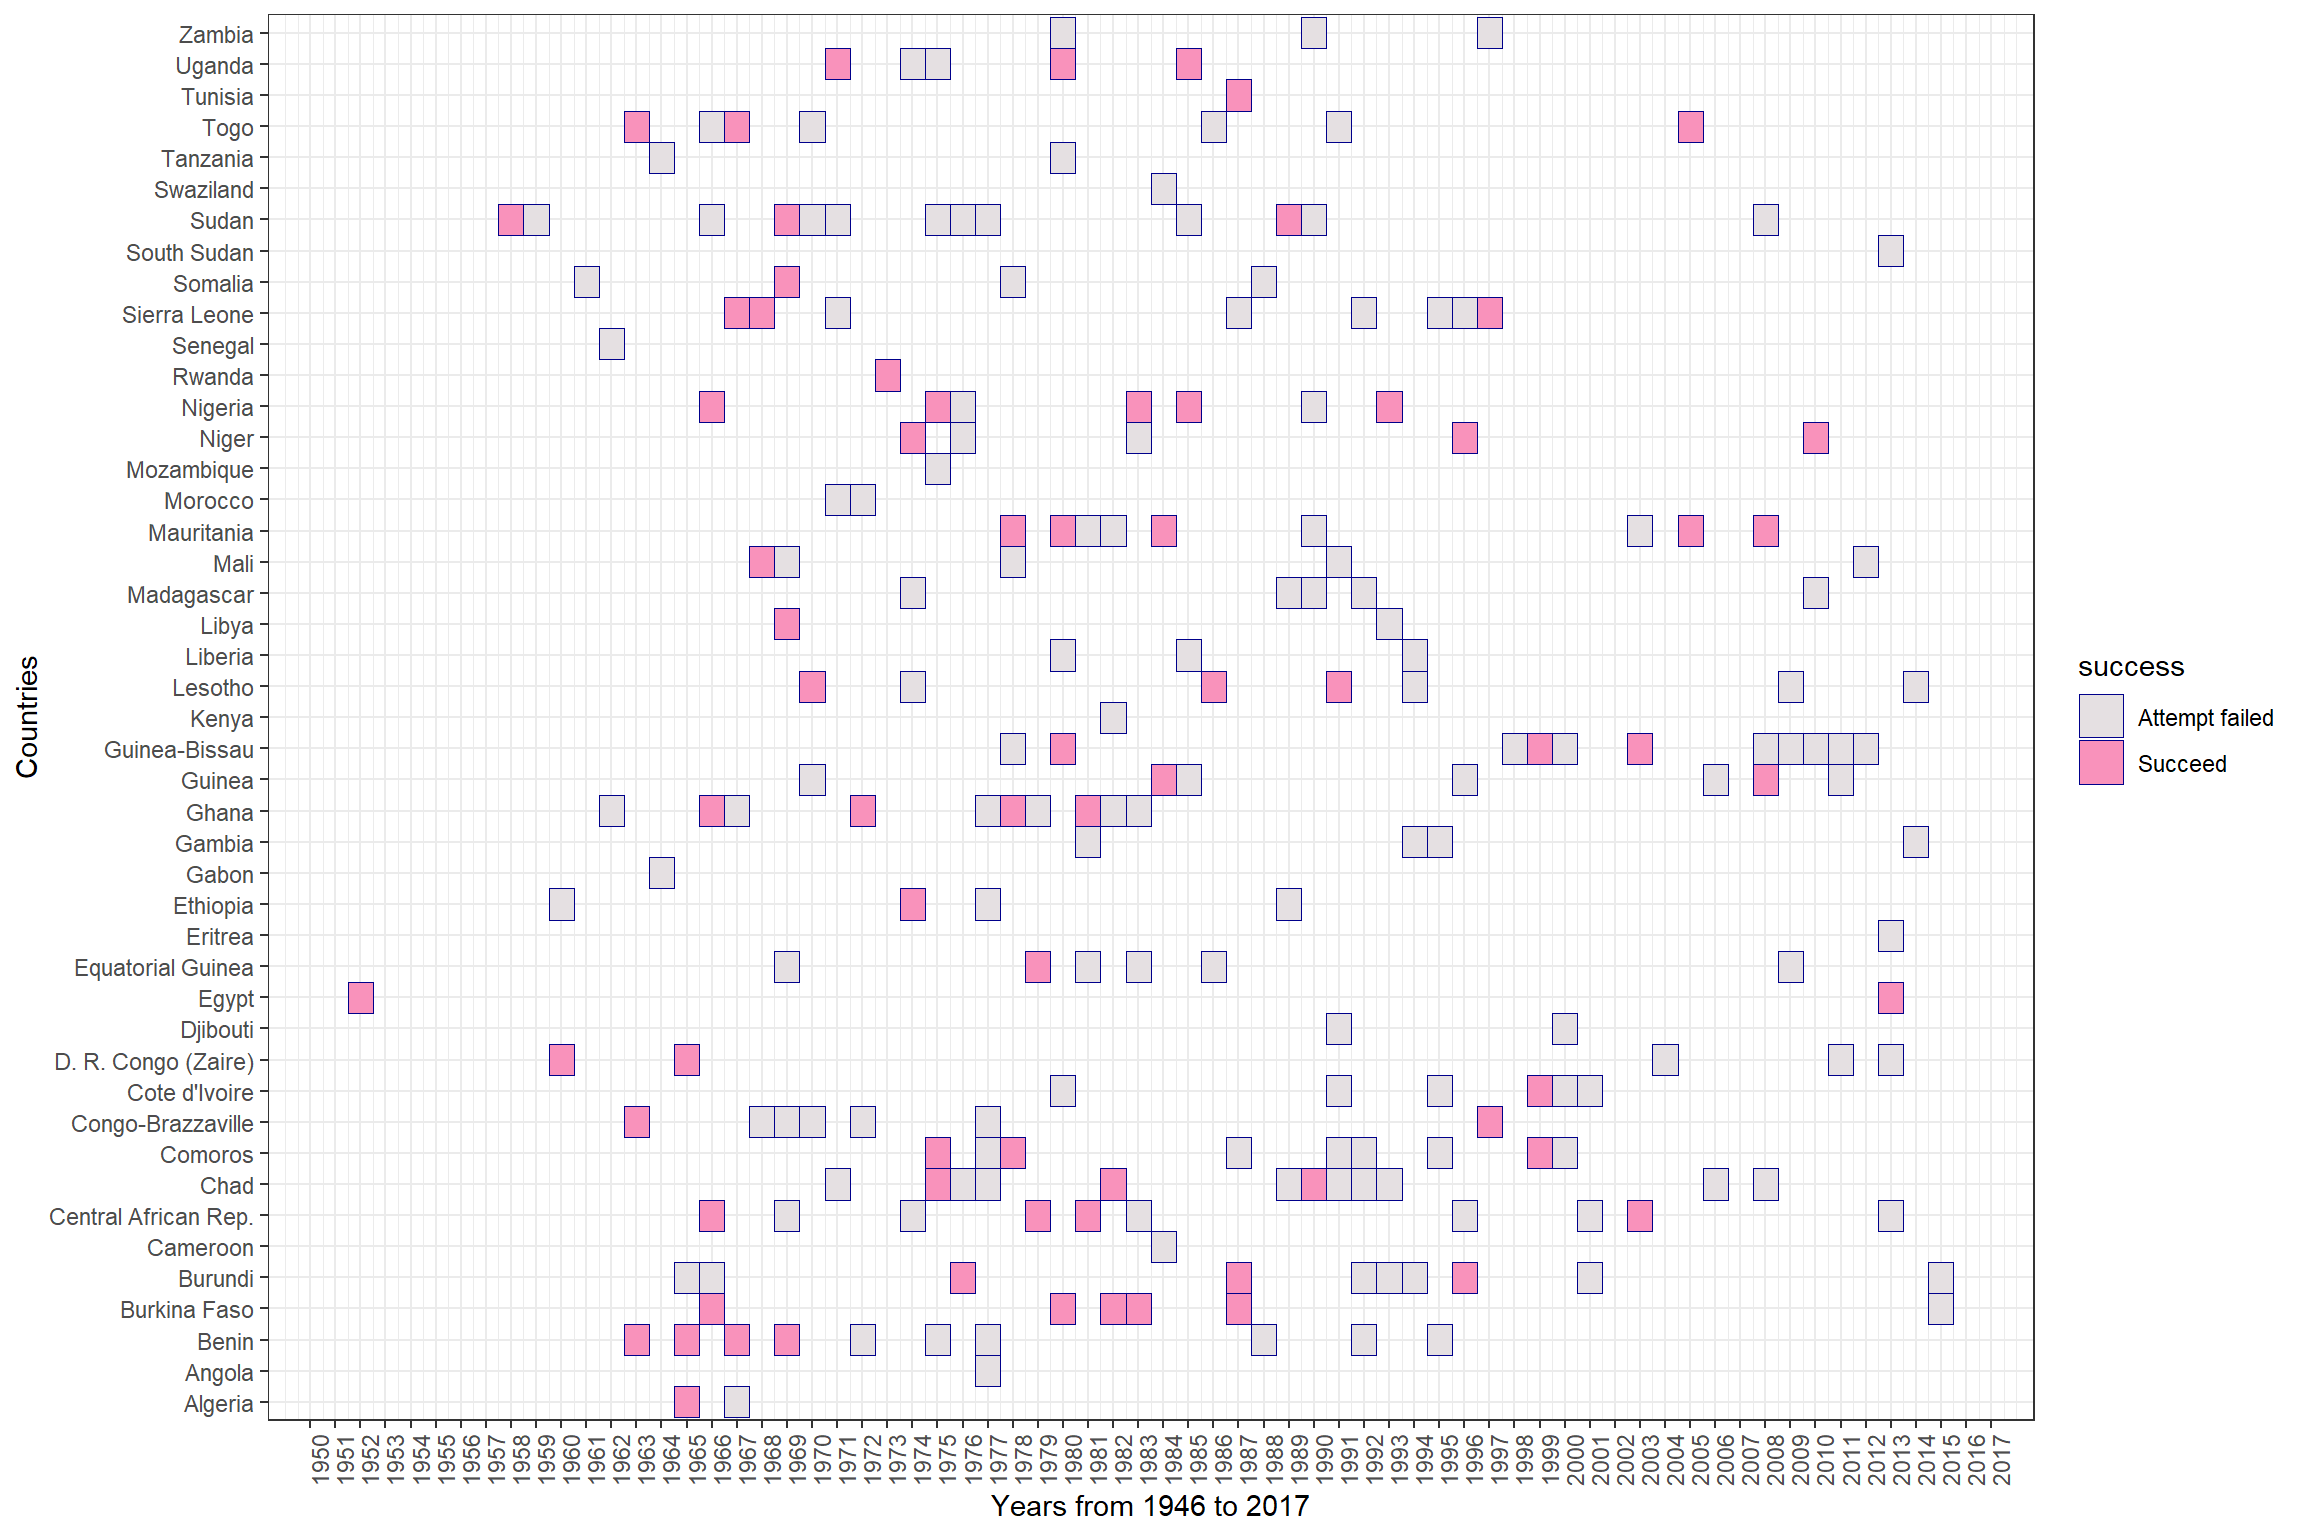
Thanks for taking the time to read this first and not so perfect post.
I tried to access the Jonathan Powell Dataset but was not able to get rid of the webpage.↩︎
Feel free if you want to add some other ways to achieve the result in the comments.↩︎
You will surely ask me what about the Zimbabwean coup? Let’s open the debate in comments.↩︎


