Data wrangling after pdf extraction with R - Part Two
In my day to day work, I use to extract data from PDF
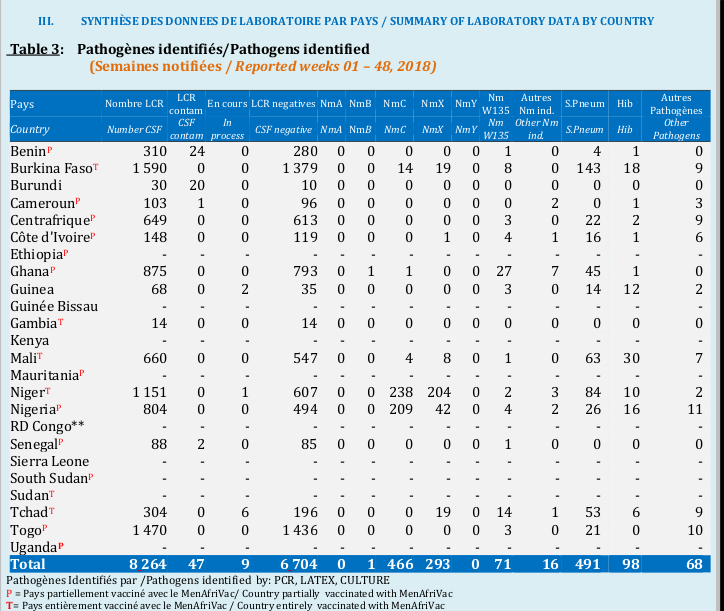
files - especially reports. For a recent analysis, I had to work on data extraction on PDFs from WHO reports on meningitis.
I wanted to find an automated way to extract tables from multiple PDFs and work
on them to generate report using data-frames/tibble. A little search leads me to the tabulizer package which depends on rJava. In this series of posts, I will show how I handled data wrangling just after table
extraction using tabulizer on one PDF report. This post is the second and last one in the series. You may want to take
a look on the first post.
Let’s recall what we planned to do:
Split the columns so that we can have the data separatedRemove the empty lines at the top of the data-frame and remove empty columns.
Remove the
TandPat the end of country namesGive meaningful column names to my data and convert to the correct type each column.
As the first step has been done in the first post, we will move to the second, third and fourth one. But just to remember, here is the example of table we are extracting.
Removing empty lines and correcting country names
The second step will be to clean the data set and remove empty lines as well as columns, in order to shape it toward our final output we had in mind.
The process for dealing with country name and empty lines at the begining of the data-frame can be divided in five steps:
- Lowercase each country name (
tolower) - Remove trailing “T” or “P” at the end of country names (
stringr::str_remove) - Convert to
ascii(iconv) - Filter on the
countries_namesvector. (dplyr::filter) - Remove empty lines
The country names are in the first column, so these steps will be done by mutating the first column of the data-frame. I will repeat myself for clarity purposes.
pathogen_final_data <- pathogen_final_data %>%
  mutate(
    #lowercase
    columns_1 = tolower(columns_1),
    #remove trailling "T" or "P" or "*" presents one time or more
    columns_1 = str_remove(columns_1, "(t|p|\\*+)$"),
    #convert to ascii by removing accents
    columns_1 = iconv(columns_1, from = "UTF8",
                      to = "ASCII//TRANSLIT")
    ) %>%
  #filter on country_names
  filter(columns_1 %in% countries_names) %>%
  #removing empty columns
  filter_empty_column() %>%
  #renaming once again columns
  rename_columns()

#remember the have a look function?
have_a_look()
This country part is almost done, but I still have some work to do to
end up completely the process:
- Remove all non numeric characters in the data from the second column to the end
- Remove empty columns once again and rename the data-set.
I will first create a function which will remove every non digit withing a character
vector and map the data-frame to it.
#the function will remove all string within a vector. Regular expression
#for non digits: \\D
remove_string <- function(vect){ str_remove_all(vect, "\\D")}

#keep the first column of countries
first_column <- pathogen_final_data %>% select(columns_1)

#remove string from the other columns
string_cleaned <- pathogen_final_data %>%
  map_dfc(remove_string) %>%
  filter_empty_column()

pathogen_final_data <- bind_cols(first_column, string_cleaned) %>%
  rename_columns()

#printing to have a look
have_a_look()
Now that we are reaching the final output, we noticed some lines with more non empty values than expected. Let’s take a look on non empty values per country, one line representing one country.
#number of non empty cells
non_empty <- function(vect) sum(vect!="")

#creating the number of non empty per line
pathogen_final_data <-  pathogen_final_data %>%
  #rowise for line computations
  rowwise() %>%
  do(nb_nonempty = non_empty(.)) %>%
  #turning back to tbl_df
  summarise(nb_nonempty = nb_nonempty) %>%
  #binding with pathogen data
  bind_cols(pathogen_final_data)

pathogen_final_data %>%
  print_column(c(columns_1, nb_nonempty), n_lines = 16)
I know, because I created the final_columns vector that the final data-frame
must have 15 columns. This leads for each country 15 non empty values or less. This is almost true for every country, except some
of them with more than 15 non empty (burkina faso) values. This is partly due to
the split process done in the previous post. For some countries where the number of non empty values is 16, the thousand digit has been separated from rest of the number in
the first column representing the number of cases. For those where the number of non empty values is
17, it also comes from the thousand digit, not only in the first column, but also in the another column representing the number of negative lcr. We can therefore divide our data in three main parts:
- First part representing the empty lines with only the country name as value,
- Second part with number of non-empty values equal to the length of my
final_columns, - Third part with bad columns coming from the splitting process.
Giving meaningful column names to my data and converting to the correct type
This section will be more funny. We will proceed in three main steps:
Filter the countries where the number of empty values is less or equal to the number of columns desired and work on them to have my final database (empty lines with only country names and good columns).
Filter countries where the number of empty values is greater than the number of columns desired and replace the second column by the second column pasted with the third one. Do the same with other columns where the thousand digit have been separated.
Row-bind all the data set and give a correct type to each column by mapping with
purron a function.
To start, we will create a function to filter on empty values in a vector since we will use this type of filtering in the process.
filter_empty_lines <- function(vect) vect[vect != ""]

#filtering on empty lines
empty_lines <- pathogen_final_data %>%
  #empty lines
  filter(nb_nonempty == 1) %>%
  select(-nb_nonempty) %>%
  rename_columns() %>%
  #15 columns as the number of total columns
  select(columns_1:columns_15)


#working on good columns
good_columns <- pathogen_final_data %>%
  #filtering on number of non empty less than 15
  filter(nb_nonempty <= length(final_columns) & nb_nonempty > 1) %>%
  #removing the nb_nonempty
  select(-nb_nonempty) %>%
  #removing empty columns
  filter_empty_column() %>%
  t() %>%
  as_tibble() %>%
  #filtering on empty lines
  map_dfr(filter_empty_lines) %>%
  #transpose back
  t() %>%
  as_tibble() %>%
  #renaming the columns
  rename_columns()

good_columns %>%
  print_column(everything(), n_lines = 12)
The second step will take more number of lines than the first. But we will just add some modifications to paste two columns and delete the unwanted ones. Notice that in order to filter on empty values per line, I transposed my data-frame. Please fill free to add other methods to shorten the number of lines.
bad_columns <- pathogen_final_data %>%
  #filtering on bad columns
  filter(nb_nonempty > length(final_columns)) %>%
  #changing the second column
  mutate(columns_2 = paste(columns_2, columns_3, sep = "")) %>%
  #being sure to work with the last column where I have 17 non empty values
  mutate(columns_6 = ifelse(nb_nonempty == length(final_columns)+2,
                           paste(columns_6, columns_7, sep = ""),
                           columns_6)) %>%
  mutate(columns_7 = ifelse(nb_nonempty == length(final_columns)+2,
                           "", columns_7)) %>%
  #removing unwanted columns
  select(-nb_nonempty, -columns_3) %>%
  # I don't have the choice I have to transpose
  t()%>%
  as_tibble() %>%
  #filter empty columns (lines here)
  map_dfr(filter_empty_lines) %>%
  #returning back
  t() %>%
  as_tibble() %>%
  #finally renaming columns
  rename_columns()
  #rename columns

bad_columns %>%
  print_column(everything(), n_lines = 12)
Finally, we can bind all data-frames and convert to numeric if the data contains only numeric values.
#
pathogen_final_data <- bind_rows(good_columns, bad_columns, empty_lines)

#final_columns comes from the first post.
colnames(pathogen_final_data) <- final_columns

#filling NA's
pathogen_final_data[pathogen_final_data == ""] <- NA

#A function to detect string vectors
is_not_string <- function(vect) !all(grepl("\\D", vect))

pathogen_final_data <- pathogen_final_data %>%
  #converting to numeric
  mutate_if(is_not_string, as.numeric) %>%
  arrange(countries)

#printing the final table.
pathogen_final_data %>%
  print_column(everything(), nrow(pathogen_final_data))
In conclusion
Data Management and reshaping is not an ugly task, if we use
the correct tools to come up with the final output we want. Fortunately, by
mixing correctly some tidyverse package, we can overcome huge difficulties
and enjoy reshaping data. At the end we can apply this same rule in life. All
lies in how to find the great tools and packages to make you life more happier.


